A standard model for evaluating whether an intercompany interest rate is arm’s-length can be seen to have two components: the intercompany contract and the credit rating of the related party borrower. Properly articulated intercompany contracts stipulate the:
- Date of the loan.
- Currency of denomination.
- Term of the loan.
- Interest rate.
The first three items allow the analyst to determine the market interest rate of the corresponding government bond. This intercompany interest rate minus the market interest rate of the corresponding government bond can be seen as the credit spread implied by the intercompany loan contract.
The issue of what represents an appropriate credit spread has been the subject of considerable controversy, including the Chevron Australia and GE Capital Canada litigations. The OECD and the United Nations have also commented on this issue, noting the implicit support standards discussed in these cases. The taxpayers and the tax authorities in both litigations asserted very different credit ratings for the borrowing affiliate. Even if agreement were reached on the appropriate credit rating, any economic analysis would need to provide market evidence on how to translate that credit rating into a numerical credit spread.
A recent discussion of this issue by members of the University of Lausanne’s Executive Program in Transfer Pricing (EPTP) offered an interesting case study to explore how a search of loan data provided by Refinitiv would allegedly yield a different translation of the credit rating into the credit spread than a search of corporate bond data provided by Refinitiv. Their conclusion was that the bond data provided more reliable results than the loan data as the results from the former suggested a higher intercompany interest rate than the latter. We review their case study, suggesting that both results are suspect and may have resulted from questionable uses of these databases.
The Intercompany Loan
Consider an intercompany loan from a German parent (such as Adidas, BASF, Bayer, BMW, or Daimler) to its US affiliate on October 15, 2020 with principle is $500 million where the loan is a floating rate loan for five years. While the term structure for US government bonds was upward sloping, interest rates were generally very low on this date. The Federal Reserve reports the following key interest rates for this date:
- One-year government bond rate = 0.12%.
- 12-month US LIBOR rate = 0.35%.
- Five-year government bond rate = 0.32%.
The representatives of the multinational choose an intercompany interest rate equal to 2.4% based on an analysis that the appropriate credit rating for the borrowing affiliate was BBB- and certain reasoning that the credit spread would be between 2.25% and 2.3%, which we note below.
Table 1 presents the Applicable Federal Rates (AFR) for October 2020 and 130% of these AFRs. Since the intercompany loan was a floating rate loan, the short-term AFR safe haven range likely applies. Even if the multinational insisted on relying on the mid-term AFR safe haven range, the upper end of this range is below 1.5%. The market rate for a third-party loan to a borrower with a credit rating of BBB- is clearly above the AFR safe haven range.
Table 1: Applicable Federal Rates for October 2020
|
AFR |
1.3*AFR |
|
|
Short-Term |
0.14% |
0.18% |
|
Mid-Term |
0.38% |
0.49% |
|
Long-Term |
1.12% |
1.47% |
Table 2: US Interest Expense Under Three Intercompany Interest Rates
|
|
IRS |
Taxpayer |
Germany |
|
Interest Rate |
1.6% |
2.4% |
3.2% |
|
Interest Expense |
$8 |
$12 |
$16 |
Table 2 shows the annual intercompany interest expense borne by the US affiliate under three assumptions with respect to what represents an arm’s length rate. Since the multinational choose a 2.4% intercompany interest rate, the US affiliate paid its German parent $12 million per year. We shall note that if an IRS Examiner relied on the loan analysis presented by the members of EPTP, the interest rate would be lowered to 1.6%, reducing the interest deduction to only $8 million per year. The German tax authorities, however, could assert that its interest income should be $16 million per year by using the bond analysis from the members of EPTP to assert an interest rate of 3.2%.
Loan Analysis
The EPTP members selected 22 loan transactions from the five-year period from October 15, 2015 to October 15, 2020 using Refinitiv’s LoanConnector database. Only 2 of these transactions were after the beginning of the COVID-19 pandemic.
Each of these transactions had the base rate US LIBOR. The median loan margin was 1.25%. The overall interest rate for each transaction was the LIBOR rate plus the loan margin. On October 15, 2020, the 12-month US LIBOR rate was 0.35%. Their analysis therefore suggests an arm’s length rate equal to 1.6%.
This 1.6% interest would represent a credit spread equal to 1.48% since the one-year government bond rate was 0.12%. The credit spread for LIBOR based loans can also be seen as the loan margin plus a TED spread, which is the difference between the LIBOR rate and the interest rate on the corresponding government bond rate. In this case, the TED spread was 0.23%.
My April 27, 2020 discussion of intercompany financing noted the spike in credit spreads that occurred soon after the extent of the COVID-19 pandemic became apparent. Credit spreads on BBB rated corporate debt reached 4% by the end of March, but regressed the rest of the year. Credit spreads before the pandemic, however, were quite modest. The search strategy by the members of EPTP resulted in a set of third-party loans that was dominated by observations before the start of the pandemic.
Based on the author's search criteria, John Hollas of CUFTanalytics provided a set of third-party loans (which were filed by SEC Registrants with the SEC) executed between June 2020 and October 2020 period where the borrower’s (or parent’s rating if the parent guarantees the loan) S&P issuer credit rating was BBB- at the time the loan was executed.
Table 1 provides the key information, including the borrower, the loan amount and the loan margin. The central tendency for the loan margin was 2%. The evidence from floating rate loans for the five-month period from June 2020 to October 2020 is consistent with a loan margin of 2% for borrowers with a credit rating of BBB-.
Table 1: Floating Rate Loans Provided by CUFTanalytics
|
Borrower |
Date |
Commitment Period |
Amount (Millions) |
Loan Margin |
Credit Rating |
|
Leidos Inc. |
06/18/2020 |
1.0 |
$300 |
2.0% |
BBB- |
|
Molson Coors |
06/19/2020 |
3.0 |
$1,500 |
1.5% |
BBB- |
|
Howmet Aerospace |
06/26/2020 |
4.7 |
$1,000 |
2.0% |
BBB- |
|
Capri Holdings Ltd.* |
06/25/2020 |
1.0 / .04 / 3.4 |
$2,830 |
2.125% |
BBB- |
|
Mosaic Co. |
07/24/2020 |
2.3 |
$2,200 |
2.0% |
BBB- |
|
Brookfield Property |
07/29/2020 |
1.1 / 3.1 |
$3,535 |
3.0% |
BBB- |
|
Expedia Group** |
08/05/2020 |
3.4 |
$855 |
2.5% |
BBB- |
|
EPR Properties*** |
06/29/2020 |
1.7 |
$1,450 |
1.375% |
BBB- |
|
Waddell & Reed Financial |
10/20/2020 |
1.0 |
$100 |
1.7% |
BBB- |
|
Qwest Corp. |
10/23/2020 |
7.0 |
$215 |
2.0% |
BBB- |
|
Boeing Co. |
10/26/2020 |
1.0 |
$3,100 |
1.7% |
BBB- |
Chart 1 below shows the median interest rates by month (in months with sufficient data to measure an interquartile range) over the October 2015-October 2020 period. This chart was generated in EdgarStat's CUFT Loan Agreements Database and reflects the following search criteria:
- S&P Principal Obligor Credit Rating: BBB-
- Tranche Execution Date: Oct. 2015 - Oct. 2020
Chart 1: Time Series of BBB- 3rd-Party Loan Margins Oct. 2015-Oct. 2020
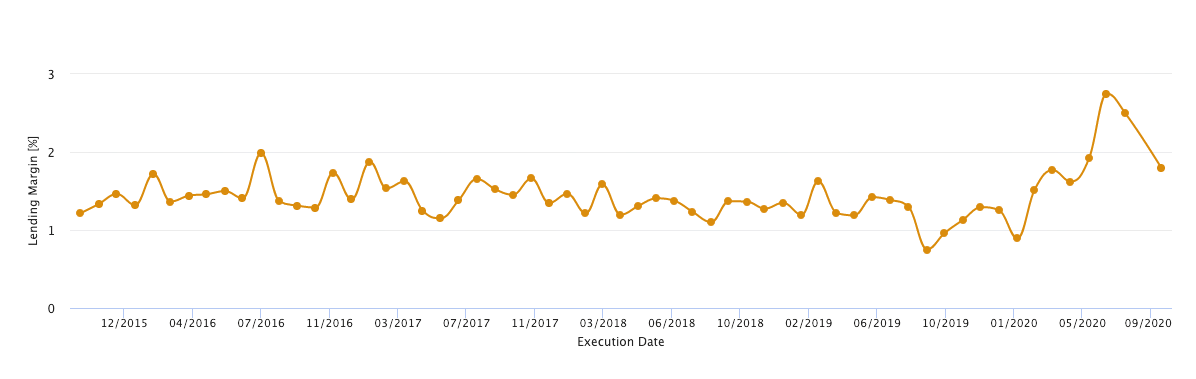
Together, they illustrate that while a loan margin of only 1.25% might be a reasonable estimate for the market rate for borrowers with a credit rating of BBB- during periods where financial markets were tranquil, financial markets following the start of the pandemic exhibited higher credit spreads and loans margins for any given credit rating.
* The Capri Holdings loans had four tranches. Three had a 2.125% loan margin with varying commitment periods, and one tranche was modestly higher with a 2.25% loan margin with a commitment period of 1 year.
** Parent credit rating (borrower not rated).
*** The EPR Properties loans had two tranches. Another tranche had a 1.75% loan margin and a commitment period of 2.7 years..
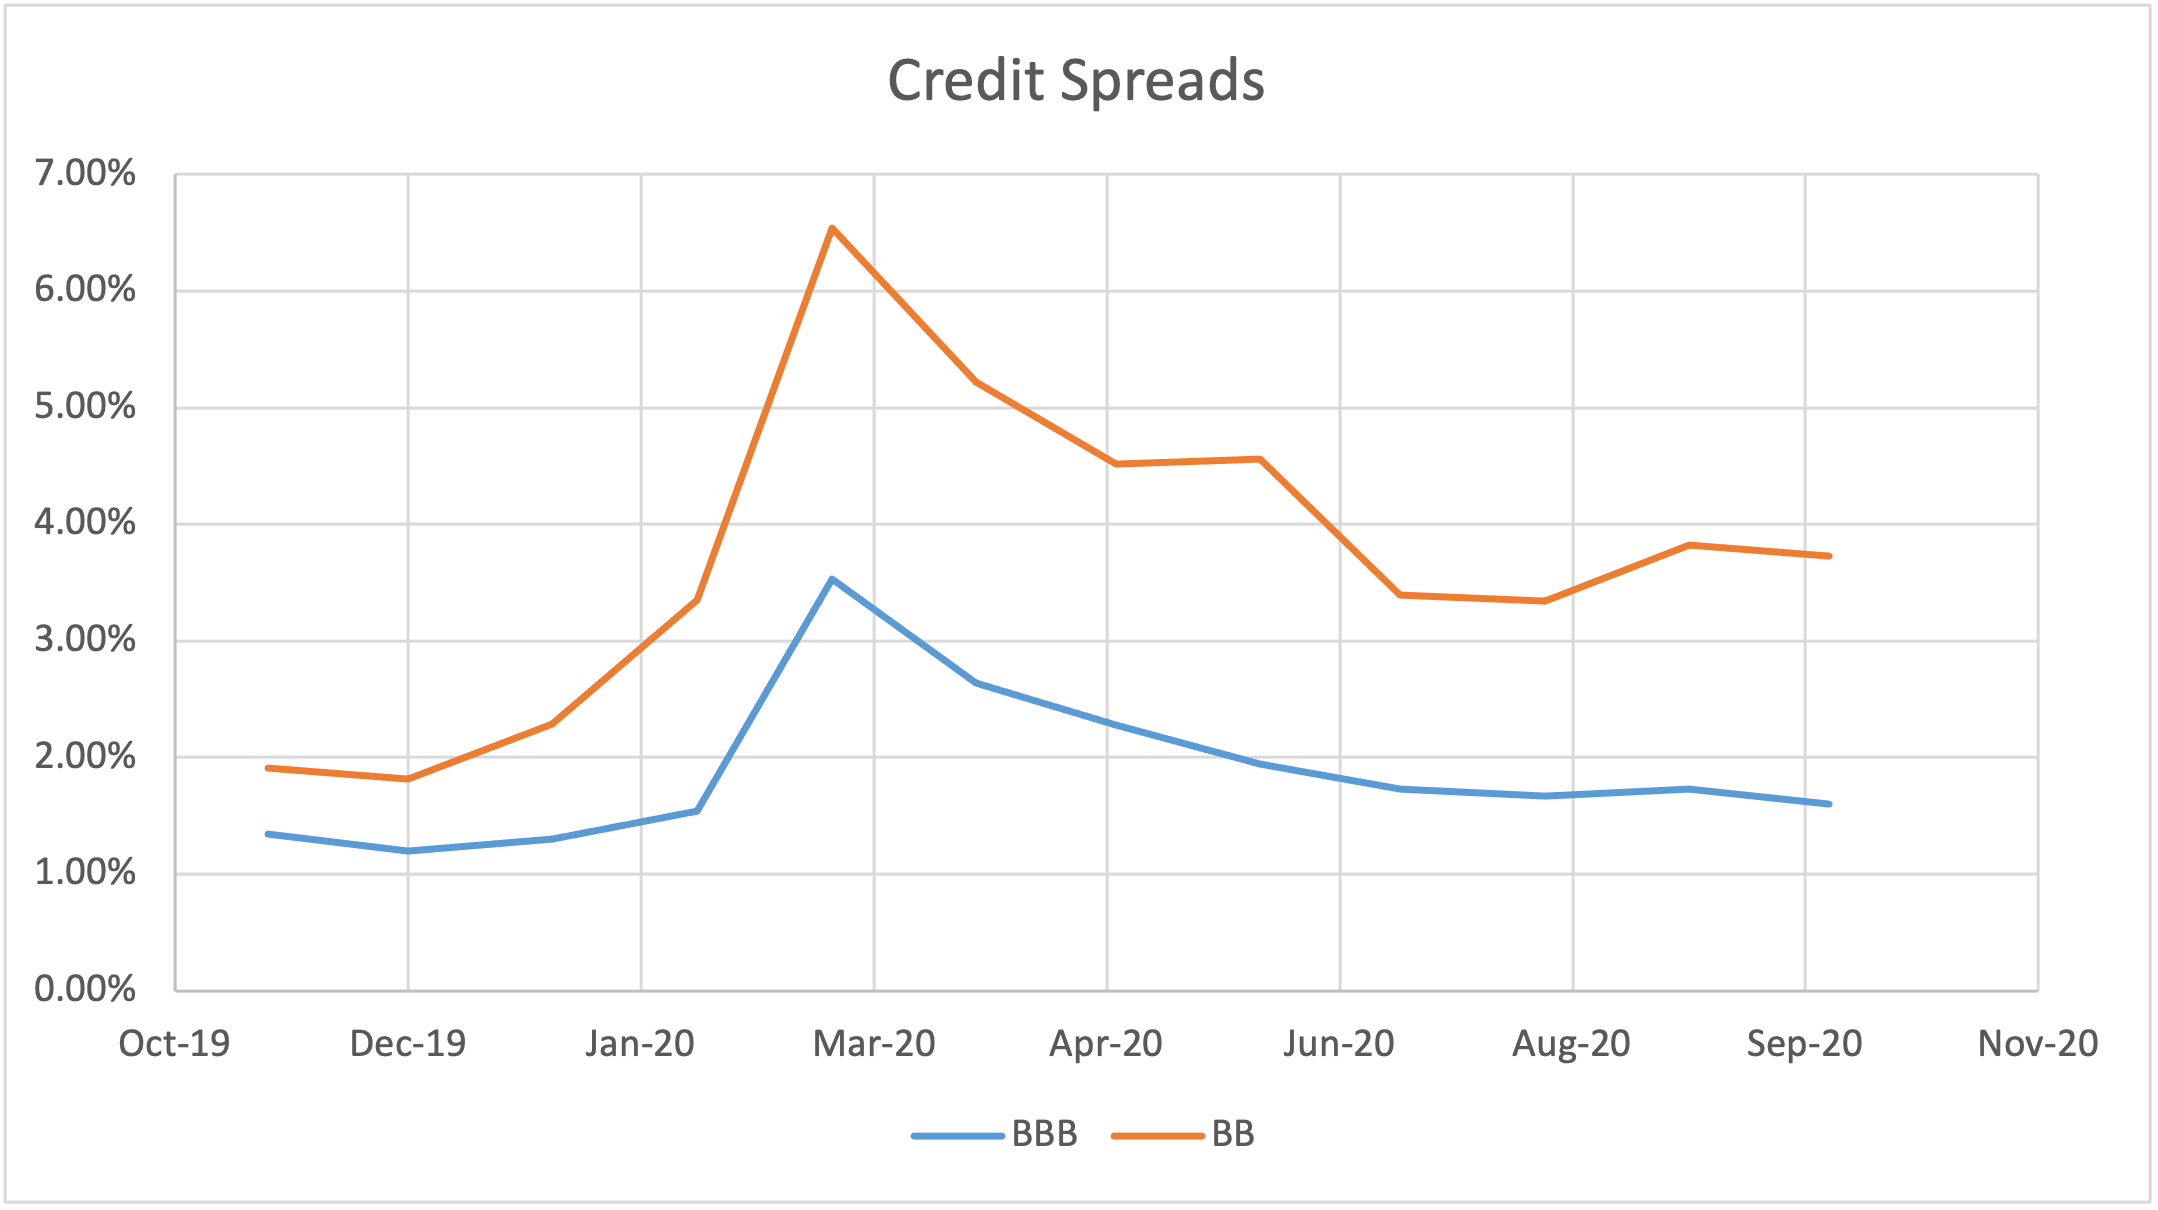
Evidence from Corporate Bond Market
The following chart shows a monthly measure of credit spreads for corporate bonds rated BBB and BB as presented by Cincinnati Asset Management, which releases a monthly newsletter of corporate bond spreads using data provided by Barclays Capital. During the period from November 2019 to January 2020, the credit spread for bonds rate BBB was less than 1.3% while the credit spread for bonds rated BB was only 2%. These spreads spiked during March of 2021 but partially retreated during the following month. By October 2020, the credit spread for bonds rated BBB was 1.6%, while the credit spread for bonds rated BB was 3.7%.
This evidence calls into question the conclusion that the appropriate credit spread for intercompany loan with a credit rating of BBB- should be less than 1.5%. As we noted, the member of EPTP reached this conclusion by examining a set of third-party loans that were dominated by observations before the start of the pandemic. These members of EPTP admit:
Pricing an intercompany loan based on the bond approach offers the advantage of taking into account the prevailing market conditions and the remaining term, in contrast with the loan approach, whereby the pricing is based on historical loan transactions, which may not be representative.
This observation highlights the need to select third-party loans that were initiated during a period closer to the data of the intercompany transaction than the five-year span used in the search process utilized by the members of EPTP.
Chart 2: Credit Spreads Oct. 2019-Oct. 2020
The members of EPTP selected 25 corporate bonds issued by 12 corporate borrowers and calculated the yield to maturity as of October 15, 2020 as their bond approach. This approach performed three questionable adjustments, which results in an adjusted range of yields that were 0.2% lower than the calculated yield to maturity.
We discuss two caveats to their approach. One is to note appropriate adjustments should have been made. The other is to note how their search for allegedly comparable agreements may have results in an upwardly biased range.
The median yield-to-maturity was from a corporate bond issued by Hyatt Hotels and equaled 3.35%. Their approach calculated the credit spread as this yield-to-maturity minus an alleged swap rate of 0.5%, concluding that the credit spread was 2.85%*. The credit spread, however, is the yield-to-maturity minus the corresponding government bond rate. Since they were examining yield-to-maturities for bonds with five years before maturity, the appropriate government bond rate was the five-year government bond rate, which was 0.32% on October 15, 2020. The credit spread for this corporate bond was therefore 3.03%.
*(While their paper claims the five-year swap rate on October 15, 2020 was 0.5%, other reporting notes this rate was only 0.38%, according to the ICE Benchmark Administration Limited (IBA), ICE Swap Rates, 11:00 A.M. (London Time), Based on US Dollar, Five-Year Tenor [ICERATES1100USD5Y].)
Their approach failed to add back the one-year government bond rate, which was 0.12% on October 15, 2020. Had an appropriate set of calculations been performed, this observation would suggest a 3.15% interest rate, which happened to be 0.2% lower than the observed yield-to-maturity. Note that the difference between the 5-year government bond rate and the 1-year government bond rate was 0.2%. In other words, the appropriate adjustment reflects the fact that floating rates reflect short-term interest rates, while the yield to maturity calculation reflects a 5-year term.
Their approach instead included a questionable illiquidity premium, which they asserted was 0.3%. Their ultimate conclusion was that this observation suggested a 3.15% interest rate. In other words, three wrongs made a right in this particular case, as their errors were exactly offsetting.
We noted that the 25 observations came from corporate bonds issued by 12 companies. Bonds issued by Expedia represented 6 of these observations, while two of these observations were bonds issued by Kohl’s. These eight observations had the highest reported yields. Both companies had their credit rating lowered from BBB to BBB- at the beginning of the pandemic. It is entirely possible that market participates viewed their credit standing even more harshly by October.
Corporate bonds issued by hotel or casino corporations constituted 10 of the observations. The observed yield to maturities were near or above 3%. Even during normal periods, credit ratings for such corporations then to be BBB or lower. Some of these corporations had their credit ratings downgraded to BBB- at the beginning of the pandemic. Given the decline in revenues for this sector, it is entirely plausible that the market would have judged their credit standings more harshly during October 2020.
As an illustration, we should note two newly issued corporate bonds by Hyatt Hotels on April 23, 2020 each for $450 million. One corporate bond had a term of five years and a coupon rate of 5.375%, while the other bond had a term of 10 years and a coupon rate of 5.75%. Both coupon rates represent a spread over the yield on the corresponding government bond rate near 5%, which was consistent the credit spread for corporate bonds rated BB in April 2020, as reported by Barclay’s Capital.
Table 2 presents key information on other newly issued corporate bonds issues during the same five month period used in Table 1 for third-party loans. Each of the third-party borrowers had BBB- credit ratings. The credit spread was calculated as the difference between the stated interest rate and interest rate on the corresponding government bond (GB Rate). The two corporate bonds issued to life science companies had credit spreads in excess of 2%, while the remaining corporate bonds had credit spreads ranging from 0.73% to 1.73%.
Table 2: Key Information on Newly Issued Corporate Bonds
|
Borrower |
Date |
Term (Years) |
Interest rate |
GB rate |
Spread |
|
CNH Industrial Capital |
7/15/2020 |
5 |
1.87% |
0.28% |
1.59% |
|
Conagra |
11/1/2020 |
7 |
1.38% |
0.63% |
0.75% |
|
Entergy Texas |
9/15/2000 |
10 |
1.75% |
0.68% |
1.07% |
|
Equinix |
9/15/2000 |
5 |
1.00% |
0.27% |
0.73% |
|
Equinix |
9/15/2000 |
8 |
1.55% |
0.46% |
1.09% |
|
Equinix |
9/15/2000 |
30 |
2.95% |
1.43% |
1.52% |
|
Jeffries Group |
10/15/2020 |
12 |
2.75% |
0.74% |
2.01% |
|
Omega Healthcare |
8/1/2020 |
10 |
3.38% |
0.55% |
2.83% |
|
Perrigo |
6/19/2020 |
10 |
3.15% |
0.70% |
2.45% |
|
Steel Dynamics |
10/15/2020 |
7 |
1.65% |
0.52% |
1.13% |
|
Steel Dynamics |
10/15/2020 |
30 |
3.25% |
1.52% |
1.73% |
Corporate bond yields are available from a variety of sources, including Barclay’s Capital, Bloomberg, Refinitiv and S&P Global. Each of these sources provide information on the central tendency for the credit spread for any credit rating at various points in time. We noted earlier that during October 2020 the credit spread for bonds with credit ratings of BBB was 1.6%, while the credit spread for bonds with credit rating of BB was 3.7%. A credit spread of 3% would be typical for bonds with credit rating of BB+, while the appropriate credit spread for bonds with credit ratings of BBB- would be closer to 2.3%.
Concluding Remarks
The EPTP paper raises a crucial issue in the evaluation of whether an intercompany interest rate is arm’s length, which is the translation of the estimated credit rating into an appropriate credit spread. The paper considers a case study with a clear intercompany contract and an agreed-upon BBB- credit rating. The date of this case study’s intercompany loan was October 15, 2020, which followed the beginning of the pandemic by over six months.
The EPTP paper posed a false contrast between the use of loan data versus corporate bond data. Their particular selection process suggested loan margins of only 1.25% versus corporate bond spreads in excess of 3%. Our discussion notes the credit spread implied by a 1.25% loan margin would be 1.5% because the TED spread was near 0.25%.
We call this a false contrast as the selection of third-party borrowing agreements in the EPTP paper was based on questionable criteria. The loan data was drawn mostly from agreements that preceded the pandemic. We presented loan data following the pandemic that suggests the loan margin should be closer to 2% rather than 1.25%.
We also note that the high corporate spreads evidenced from the corporate bonds in the secondary market may have been dominated by borrowers which were viewed by the market as having slipped below BBB- rating. A broader review of the corporate spreads reported for BBB- rated bonds should be considered whether the data provider is Refinitiv, Barclays, Bloomberg or S&P Capital. We took the limited step of examining recent corporate bond offerings for borrowers with BBB- credit ratings. The corporate spread implied by these bond offerings are more consistent with the evidence from recent loan offerings.
References
Thomas Petrakos, Vikram Chand and Amanda Pletz, “Interest Rate Benchmarking for Transfer Pricing Purposes: A Comparison between the Loan and the Bond Approach”, International Bureau of Fiscal Documentation Transfer Pricing Journal, July 2021.
Harold McClure, “Calculating Credit Spreads During A Pandemic,” April 27, 2020, Law360.