The Inter-American Center of Tax Administrations (CIAT) has published materials under the heading “The Cocktail” which propose solutions to make transfer pricing control more manageable, simple and certain. The CIAT transfer pricing “Cocktail” asserts that many transfer pricing analyses do not select the most appropriate transfer pricing method.
Administrative Tribunal, Case No TAT-RF-062 is a September 2020 decision involving a Panamanian affiliate that acts as a wholesale distributor of petroleum products. The Panama tax authority Dirección General de Ingresos (DGI) issued an assessment that resulted in the affiliate owing $14 mil. in additional tax payments. The taxpayer appealed, but the Tribunal ultimately ruled in favor of the tax authority.
While the case turned on the taxpayer’s selection of a poor set of comparable companies, it is worth noting that this case featured several issues covered in CIAT’s guidance, including a reference to “The Sixth Method” and disagreements over accounting methodology in the Resale Price Method (RPM).
Case No TAT-RF-062: Transfer Pricing for a Petroleum Distribution Affiliate in Panama
The published version of this administrative tribunal decision does not specify the name of the taxpayer or the nation that exported petroleum to Panama. However, to illustrate the potential transfer pricing issues, let’s assume a situation where a Colombian affiliate produces petroleum, which it sells to its Panamanian wholesale distribution affiliate.
In its transfer pricing documentation submitted to DGI, the taxpayer selected the RPM as the most reliable method. On initial appeal of DGI’s assessment, it tried to backtrack on this, with its expert witness referring to published prices for crude oil, which is known in Latin America as “The Sixth Method” and is a variant of the Comparable Uncontrolled Price Method. However, both DGI and the Tribunal rejected this. In addition to the procedural issues, we should note, as DGI did, that the published prices for crude oil reflects the third-party price received by the middle market wholesale distribution affiliate. The arm’s length price should reflect the appropriate gross margin or discount for the wholesale distribution affiliate in consideration of its distribution function.
Ultimately, the taxpayer and the tax authority both focused on the gross margin for the distribution affiliate as compared to the gross margins of third-party distributors, and the court accepted the premise that the RPM was an appropriate approach.
The evaluation of the intercompany price under the RPM requires the determination of the appropriate gross margin for a limited function distribution affiliate. Table 1 presents an illustration of this issue under the circumstances of this litigation, where we assume:
- Third-party sales = $400 million per year;
- The distribution affiliates operating expenses = 2.75% of sales or $11 million, and
- The taxpayer’s intercompany policy has set this affiliate’s gross margin at 3.75% of sales.
Table 1 presents two other proposed transfer pricing policies. The tax authorities for Panama argued for a gross margin of 8.5% based on an application of the RPM. We shall argue that the tax authorities of Colombia could argue for a 2.5% gross margin based on another application of the RPM. These two diverse applications of the RPM would lead to double taxation equal to $24 million per year.
Table 1: Distribution Affiliate Income Statement Under Alternative Transfer Pricing Policies (in Millions)
| Panama | Taxpayer | Colombia | ||
| Sales | $400 | $400 | $400 | |
| Transfer Price | $366 | $385 | $390 | |
| Gross Profits | $34 | $15 | $10 | |
| Operating Expenses | $11 | $11 | $11 | |
| Operating Profits | $23 | $4 | -$1 | |
| Gross Margin | 8.50% | 3.75% | 2.50% | |
| Operating Margin | 5.75% | 1.00% | -0.25% | |
| Markup | 209.09% | 36.36% | -9.09% |
Transfer Pricing Issues: Questionable Selection of Allegedly Comparable Companies
While DGI had several issues with the details regarding the presentation of the financial data, it relied upon the same set of alleged comparable companies. In this case, our position is that DGI’s conclusion based on the taxpayer’s selected comparable companies was resonable. However, the taxpayer selected a set of third-party distributors that generally had higher gross margins than that of the Panamanian distribution affiliate. We contend that had the taxpayer selected comparable companies with similar functions, it could have avoided DGI’s adjustment.
The court decision does not provide the name of these companies, but it does present gross margins for all four selected comparables, as well as certain details as to the difference between sales and cost of goods sold (COGS) inclusive of excise taxes versus exclusive of excise taxes. Table 2 reproduces the 2011 to 2014 data for two of the alleged comparable companies.
Table 2.1: Gross Margin Calculation of Alleged Comparable Company 1 (in Millions)
| 2011 | 2012 | 2013 | 2014 | Average | ||
| Sales (Gross) | $12,863.00 | $13,135.00 | $12,777.00 | $12,758.00 | $12,883.25 | |
| COGS (Gross) | $11,730.00 | $12,002.00 | $11,680.00 | $11,487.00 | $11,724.75 | |
| Excise Tax | $2,037.00 | $2,077.00 | $2,027.00 | $1,981.00 | $2,030.50 | |
| Sales (Net) | $10,826.00 | $11,058.00 | $10,750.00 | $10,777.00 | $10,852.75 | |
| COGS (Net) | $9,693.00 | $9,925.00 | $9,653.00 | $9,506.00 | $9,694.25 | |
| Gross Profits | $1,133.00 | $1,133.00 | $1,097.00 | $1,271.00 | $1,158.50 | |
| Gross Margin | 10.47% | 10.25% | 10.20% | 11.79% | 10.67% |
Table 2.2: Gross Margin Calculation of Alleged Comparable Company 2 (in Millions)
| 2011 | 2012 | 2013 | 2014 | Average | ||
| Sales (Gross) | $18,919.22 | $19,301.31 | $18,083.34 | $17,209.92 | $18,378.45 | |
| COGS (Gross) | $17,987.67 | $18,423.13 | $17,116.48 | $16,092.59 | $17,404.97 | |
| Excise Tax | $1,831.55 | $1,962.66 | $1,884.04 | $1,884.04 | $1,890.57 | |
| Sales (Net) | $17,087.67 | $17,338.65 | $16,199.30 | $15,325.88 | $16,487.88 | |
| COGS (Net) | $16,156.12 | $16,460.47 | $15,232.44 | $14,208.55 | $15,514.40 | |
| Gross Profits | $931.55 | $878.18 | $966.86 | $1,117.33 | $973.48 | |
| Gross Margin | 5.45% | 5.06% | 5.97% | 7.29% | 5.90% |
Gross profits relative to sales net of excise taxes averaged 10.67% for one company and averaged 5.9% for the other company. The gross margin for the other two alleged comparable companies were approximately 6.5% and 14.5%. The tax authority reasoned that the median gross margin for these four alleged comparable companies should be used as the appropriate gross margin for the Panamanian distribution affiliate.
No effort to account for differences in functional or asset intensity was evident from the court record. While the court decision noted operating expenses, the only consideration was whether there were accounting classifications differences between how the third-party information was compiled. The representatives of the taxpayer used Compustat while the tax authority used Orbis. Since these third-party companies were publicly traded, the 10-K filings with the Security and Exchange Commission were also consulted.
My writings on limited function distributors note the following model for the gross margin under arm’s-length pricing:
GP/S = a + b(E/S) + r(A/S)
where S = sales, GP = gross profits, E = operating expenses (or more correctly value-added expenses) and A = tangible assets held by the distributor. This equation has three key parameters:
- the marginal Berry ratio (b), which will generally be less than the average Berry ratio (GP/E);
- the return to tangible assets held by the distributor (r); and
- profits attributable to intangible assets (a).
To illustrate, let b = 0.1 and r = 5%. Table 1 assumed E/S = 2.75%. While the court record did not specify the tangible asset to sales ratio for the distribution affiliate, let’s assume A/S = 14.5%. Under these assumptions, the arm’s length gross margin would be 3.75% if the distribution affiliate does not own valuable intangible assets.
Our illustration justifies the 1% operating margin for the distribution affiliate on the grounds that its functions are very limited, and its asset intensity is quite modest. The tax authority’s position that the gross margin should be 8.5%, which implies a 5.75% operating margin, leads to an absurd conclusion that the markup over value-added expenses in excess of 200%.
While the court record did not disclose the names of the alleged comparable companies, the financial data cited in Table 2 indicates that these companies likely had either significantly greater functions or held valuable intangible assets. The application of the RPM would require adjustments for material differences between the alleged comparable companies and the distribution affiliate for any analysis to be considered reliable. No such adjustments were made by the tax authority.
An Analysis Based on a Wholesale Distributor of Petroleum
Publicly traded wholesale distributors of petroleum generally receive very modest operating margins because their functions and assets are limited to the volume of goods they sell. The following chart shows the gross margin, operating expense to sales ratio, and operating margin for World Fuel Services Corp. over the 2011 to 2019 period. All financial information was derived from the 10-K filings of World Fuel Services. Table 3 shows the income statement on an average annual basis for this period.
World Fuel Services Average Annual Income Statement – 2011 to 2019 (millions):
| Sales | $36,242.66 |
| COGS | $35,386.44 |
| Gross Profits | $856.22 |
| Gross Margin | 2.36% |
| Operating Expenses | $602.23 |
| Operating Expenses/Sales | 1.66% |
| Operating Profits | $253.99 |
| Operating Margin | 0.70% |
Over the 2011 to 2019 period, gross profits represented 2.36% of sales, while operating expenses represented 1.66% of sales. The operating margin averaged 0.7%. Note that during the 2011 to 2014 period, the gross margin was approximately 1.8% and the operating expense to sales ratio was approximately 1.2% of sales. If World Fuel Services were used as a comparable in a naïve application of the RPM, the Colombian income tax authority might argue that the arm’s length gross margin should be at most 2.5%.
World Fuel Services Key Financial Ratios: 2011 to 2019
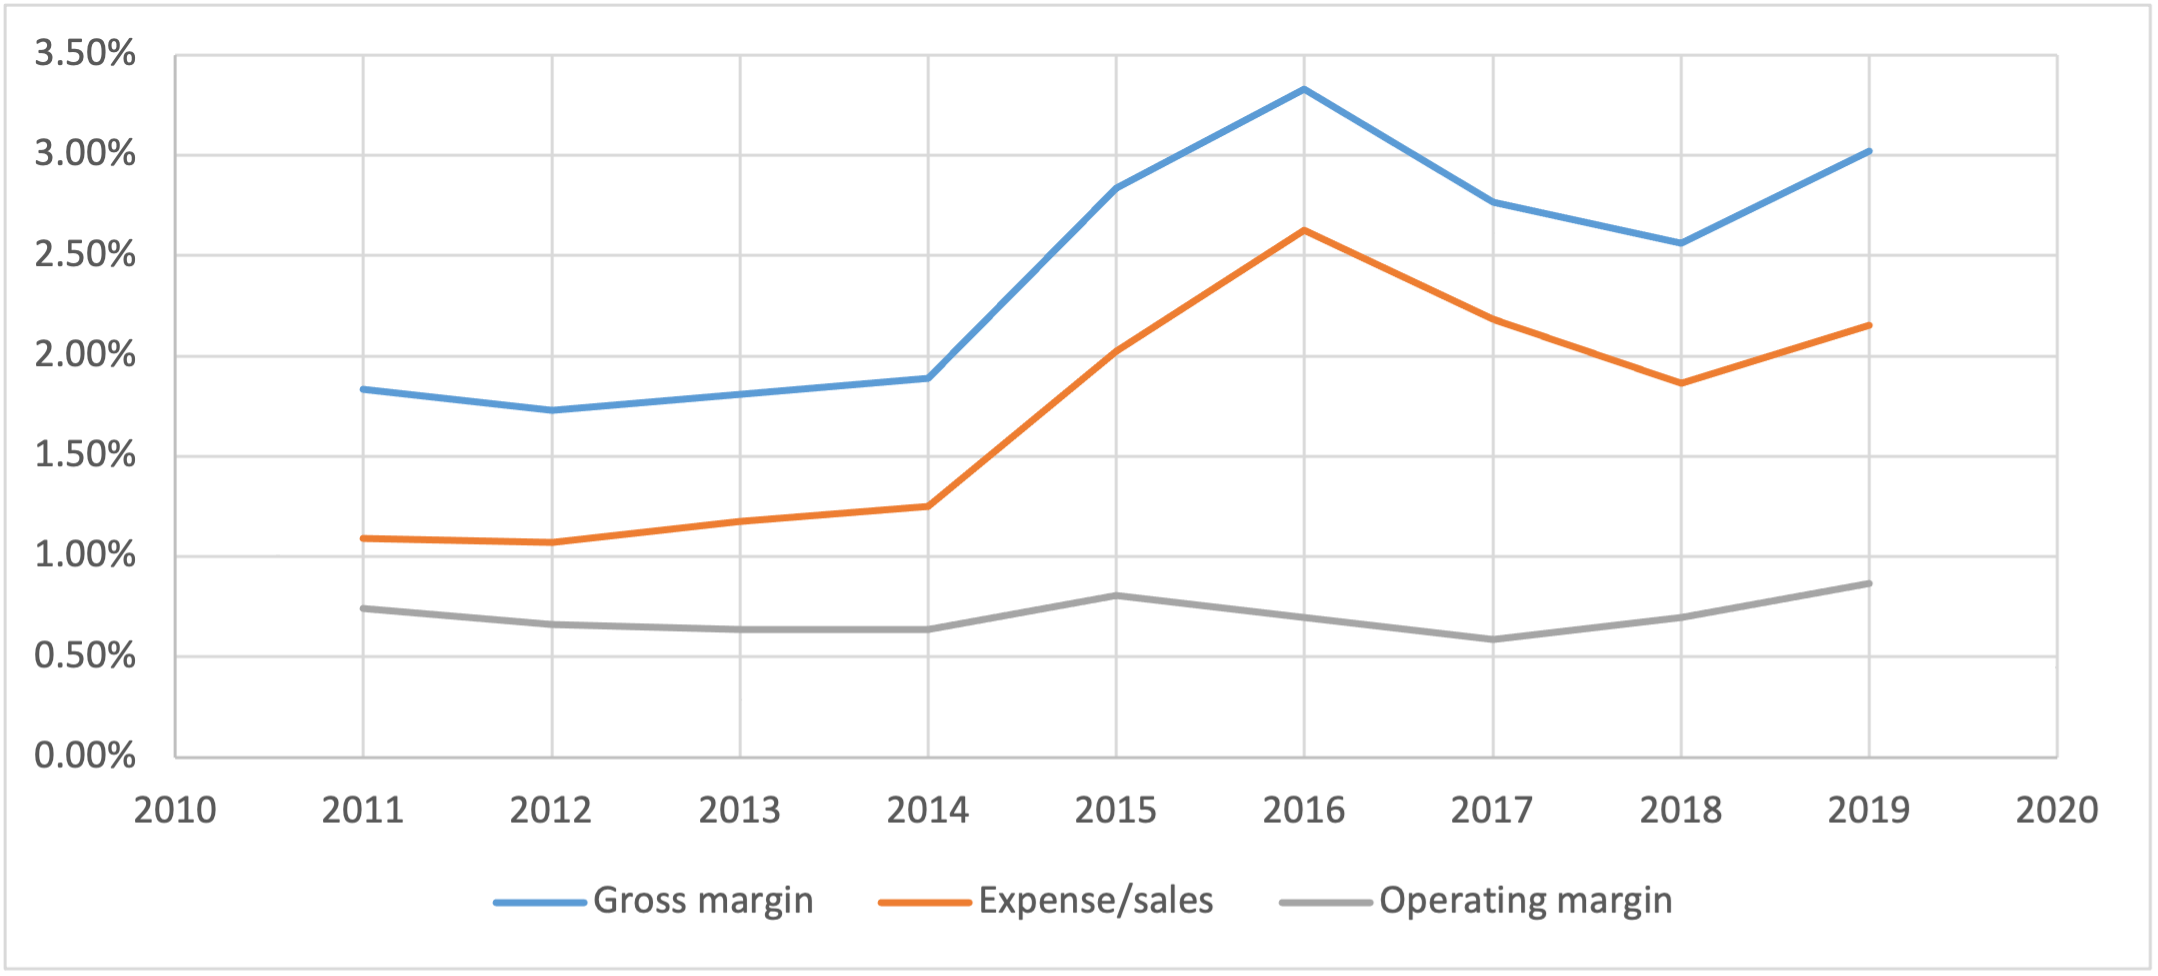
We should note, however, that such an argument would suggest that the Panamanian distribution affiliate incur operating losses. If this affiliate performed somewhat greater functions, then its gross margin under arm’s-length pricing would compensate for the cost of performing these additional functions and allow for a reasonable profit.
Takeaways
The issue in this litigation was whether the 3.75% gross margin was sufficient compensation for the selling functions of the Panamanian distribution affiliate. While many Latin American tax authorities argue for the use of a CUP approach, the use of the RPM to evaluate this discount for selling functions is warranted if the analysis is appropriately applied.
The third-party distributors considered by both the taxpayer’s representatives and the tax authority had much higher gross margins because they performed greater functions and likely owned relatively more assets than the distribution affiliate.
Publicly traded wholesale distributors of petroleum often have lower gross margins than the alleged comparable distribution affiliates, likely reflective of their fewer relative functions. A proper application of the RPM would not only consider more reasonable alleged comparable companies than were considered in this litigation, but also adjust for any remaining comparability differences between the third-party distributors and the distribution affiliate. It would be helpful had the names of the comparable companies been disclosed.
References
Inter-American Center of Tax Administrations (CIAT), Cocktail of Measures for the Control of Harmful Transfer Pricing Manipulation, Focused Within the Context of Low Income and Developing Countries, 2019.
Panama vs “Petroleum Wholesale Corp”, Administrative Tribunal, Case No TAT-RF-062, September 2020.